Why Is Solana Down? SOL Tests Its 200-Day Average
Why is Solana down? SOL fell 26% in a month with the wider crypto sell-off and now sits on its 200-day average near $89. The levels and on-chain data.
 DegenKitNovember 7, 2026 · 6 min read
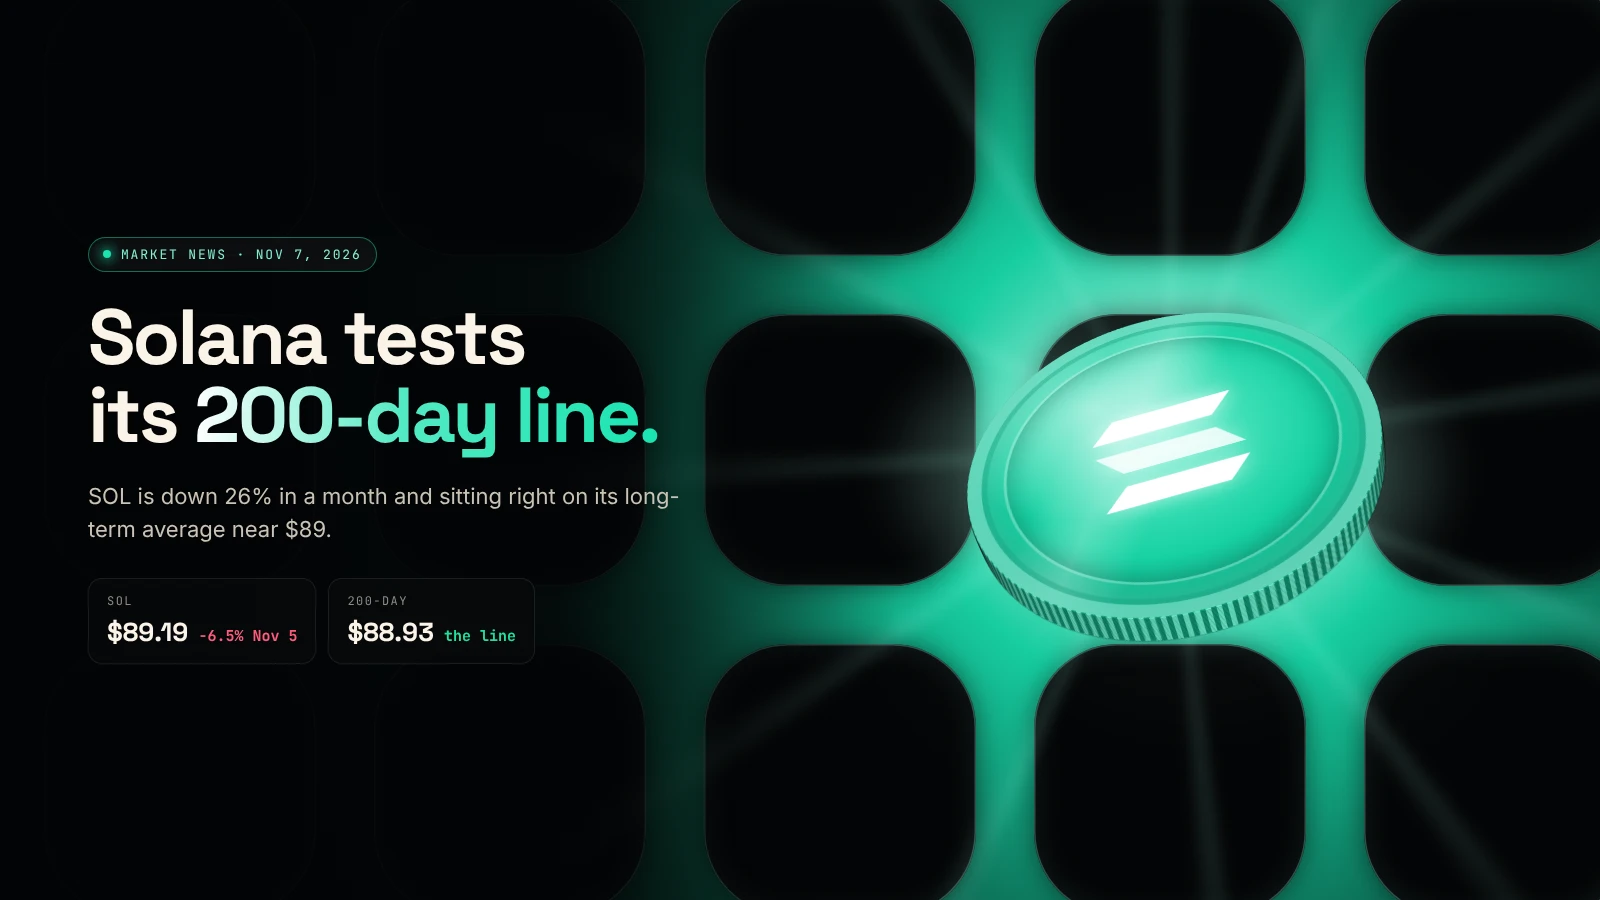
Solana is down because the whole crypto market sold off after the Binance hack, a hawkish Fed and a tech-stock rout, and SOL usually falls further than Bitcoin. SOL dropped 6.5% on November 5, 2026 to about $89.19, and now sits almost exactly on its 200-day moving average of $88.93.
Why did SOL fall more than Bitcoin?
Solana fell 6.5% on November 5 while Bitcoin fell 5.3%. Smaller, more volatile coins usually move further than Bitcoin in both directions, because more of their trading is speculative and leveraged.
The causes were market-wide: the record Binance hack on October 29, two Fed officials voting for a rate hike on October 28, and a 5.5% drop in the Nasdaq on November 5 on doubts about AI spending. About $1.26 billion of crypto positions were liquidated in 24 hours. For the full timeline, see why crypto is crashing.
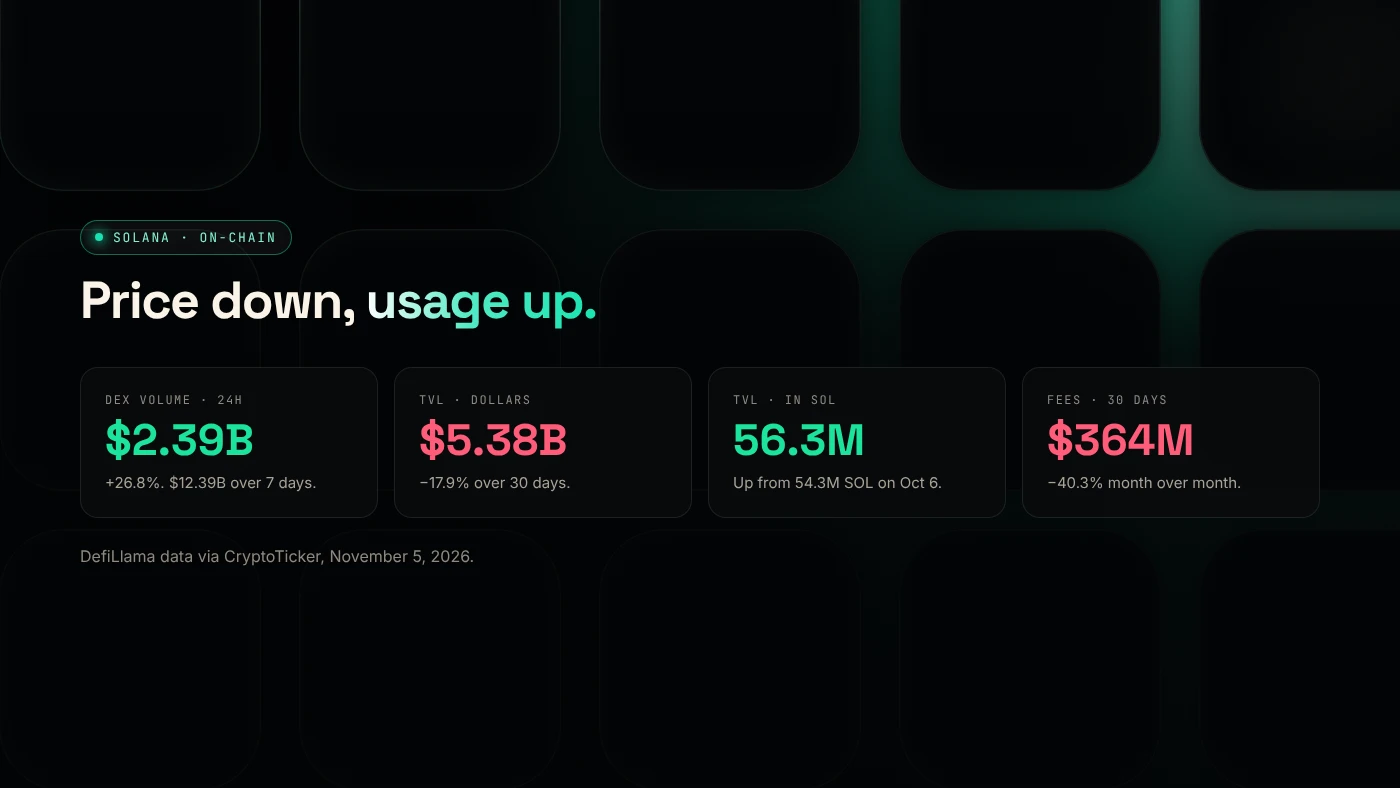
Fees on the network also fell. Solana generated $364.2 million in fees over 30 days, down 40.3% month over month, according to DefiLlama data cited by CryptoTicker. Fewer fees usually means less speculative activity.
What is the 200-day moving average?
The 200-day moving average is the average closing price over the last 200 days. It changes slowly, so traders use it to separate long-term uptrends from downtrends.
On November 5, SOL closed at $89.19 against a 200-day average of $88.93, a gap of less than 0.3%. When price sits this close to the line, buyers and sellers are evenly matched. A clear daily close below it often brings more selling. A bounce from it is often read as a sign that long-term buyers are stepping in.
Neither outcome is certain. The line is a reference point that many traders watch, which is why it can matter.
Which SOL price levels are analysts watching?
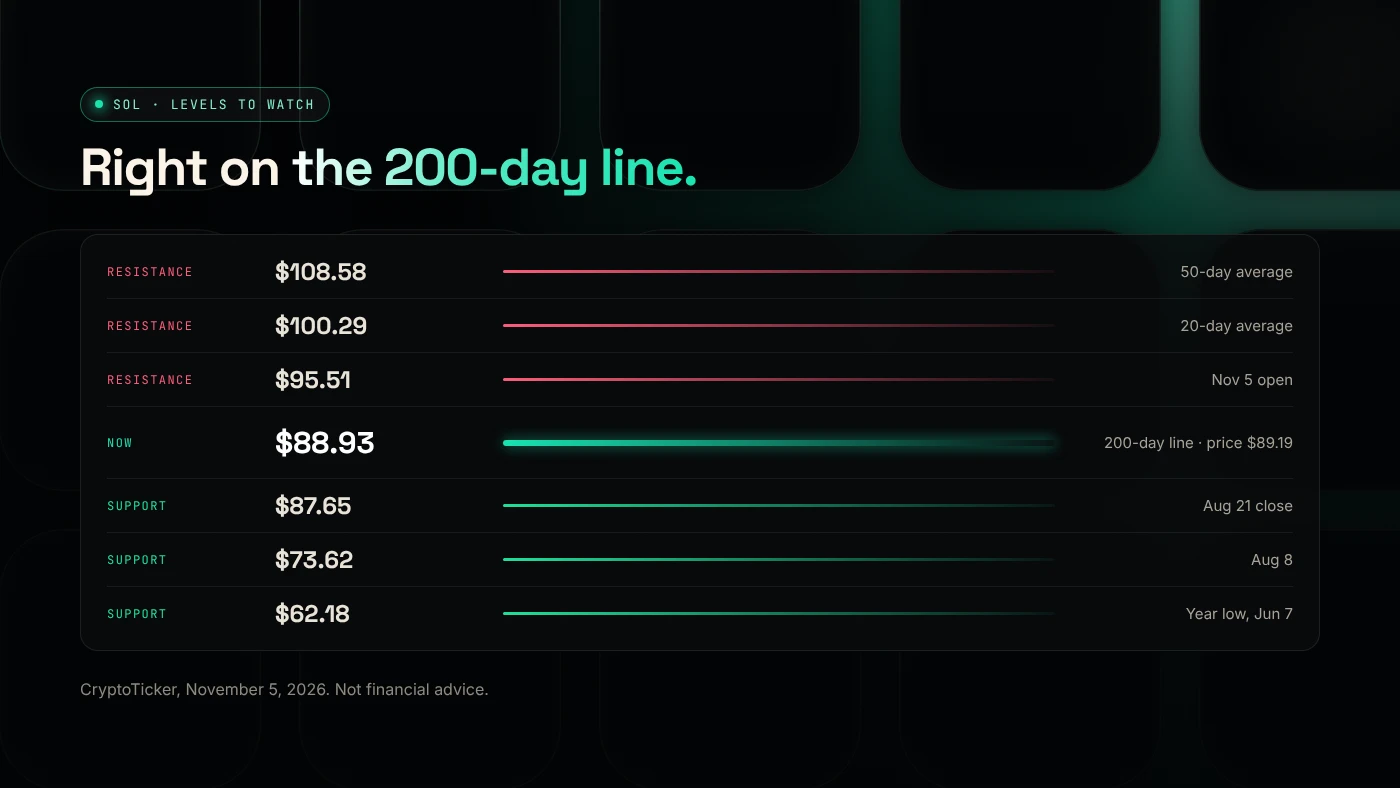
These levels come from CryptoTicker's analysis on November 5, 2026. They are past turning points, not targets.
- Support: $87.65 (the August 21 close), then $73.62, then $62.18, the year's low on June 7.
- Resistance: $95.51 (the November 5 open), $98.74 (the 100-day average), $100.29 (the 20-day average), $108.58 (the 50-day average) and $120.76, the October 6 high.
The $87.65–$88.93 zone is the area to watch. Holding it would keep the long-term trend intact. A break would put $73.62 in view.
What does on-chain data show?
The price fell, but activity on the network did not fall the same way. DefiLlama data via CryptoTicker, November 5, 2026:
- DEX volume was $2.39 billion in 24 hours, up 26.8%, and $12.39 billion over seven days, up 37.6%. Sell-offs bring heavy trading.
- TVL in dollars, the value deposited in Solana apps, fell 17.9% over 30 days to $5.38 billion. Most of that is because SOL itself got cheaper.
- TVL counted in SOL rose from 54.29 million SOL on October 6 to 56.32 million on November 5. Deposits grew while prices fell.
What does it mean for Solana token launches?
- Costs in dollars are lower. DegenKit's token creation fee is 0.28 SOL, so it costs fewer dollars when SOL is cheaper. Network fees stay small either way. See Solana fees and rent explained.
- Your pair matters more. In a SOL/token pool, a falling SOL drags your token's dollar price down too. Some creators use USDC in volatile weeks. Read SOL or USDC for your liquidity pair.
- Traders are still active, but more careful. Revoked authorities and locked liquidity matter more. The DegenKit scanner docs show what buyers check.
What are the risks?
- A break below the 200-day line could bring more selling toward $73.62.
- Pair exposure. Pools paired with SOL lose dollar value when SOL falls.
- Thin liquidity. New tokens can swing sharply when fewer buyers are active.
You can lose money in crypto. This is not financial advice.
FAQ
Why is Solana going down?
SOL is falling with the whole crypto market after the Binance hack, a hawkish Fed and a tech-stock sell-off in early November 2026. It fell 26% in a month to about $89.
How much is 1 Solana right now?
SOL closed November 5, 2026 at about $89.19. Prices change every minute, so check a live source before you act.
Is Solana a good investment?
We don't give investment advice. The facts here are that SOL is about 70% below its all-time high, sits on its 200-day average, and on-chain activity has held up better than the price.
Will Solana go up?
No one knows. Analysts in our source watch the $87.65–$88.93 zone. A hold there is read as strength, and a break as weakness.
Sources
- CryptoTicker: Solana price at the 200-day line, DEX volume, November 2026
- crypto.news: Bitcoin price today and liquidations
- DefiLlama: Solana chain data
If you are building on Solana, the DegenKit Solana launcher creates SPL tokens from your own wallet, with no code.